Understand how your business compares — and what review performance levels you MUST hit to rank, convert, and grow in 2025.
Every industry has different customer behaviours, review expectations, and conversion norms. Google knows this — and its ranking algorithm adjusts review expectations based on the type of business you’re in.
This means:
👉 A salon’s review needs are completely different from a restaurant’s
👉 A plumber doesn’t need the same review volume as a café
👉 A clinic needs higher sentiment than a retail shop
👉 Competitive industries need higher velocity and recency
This guide gives you industry-by-industry benchmarks for:
- Review quantity
- Review velocity
- Review recency
- Review rating (star score)
- Review-to-customer conversion rate
- Review the impact on the ranking
So you know EXACTLY where your business stands and what you must achieve.
Let’s break it down.
⭐ What Is “Review Conversion” Anyway?
Review Conversion Rate = Percentage of customers who leave a Google Review after their service or purchase.
For example:
- If you serve 100 customers and get 10 reviews → 10% conversion
- If you serve 200 customers and get 20 reviews → 10% conversion
The higher your conversion rate, the higher your review velocity, and the higher your ranking power. The MUVERA update HEAVILY favours businesses with strong review conversion signals.
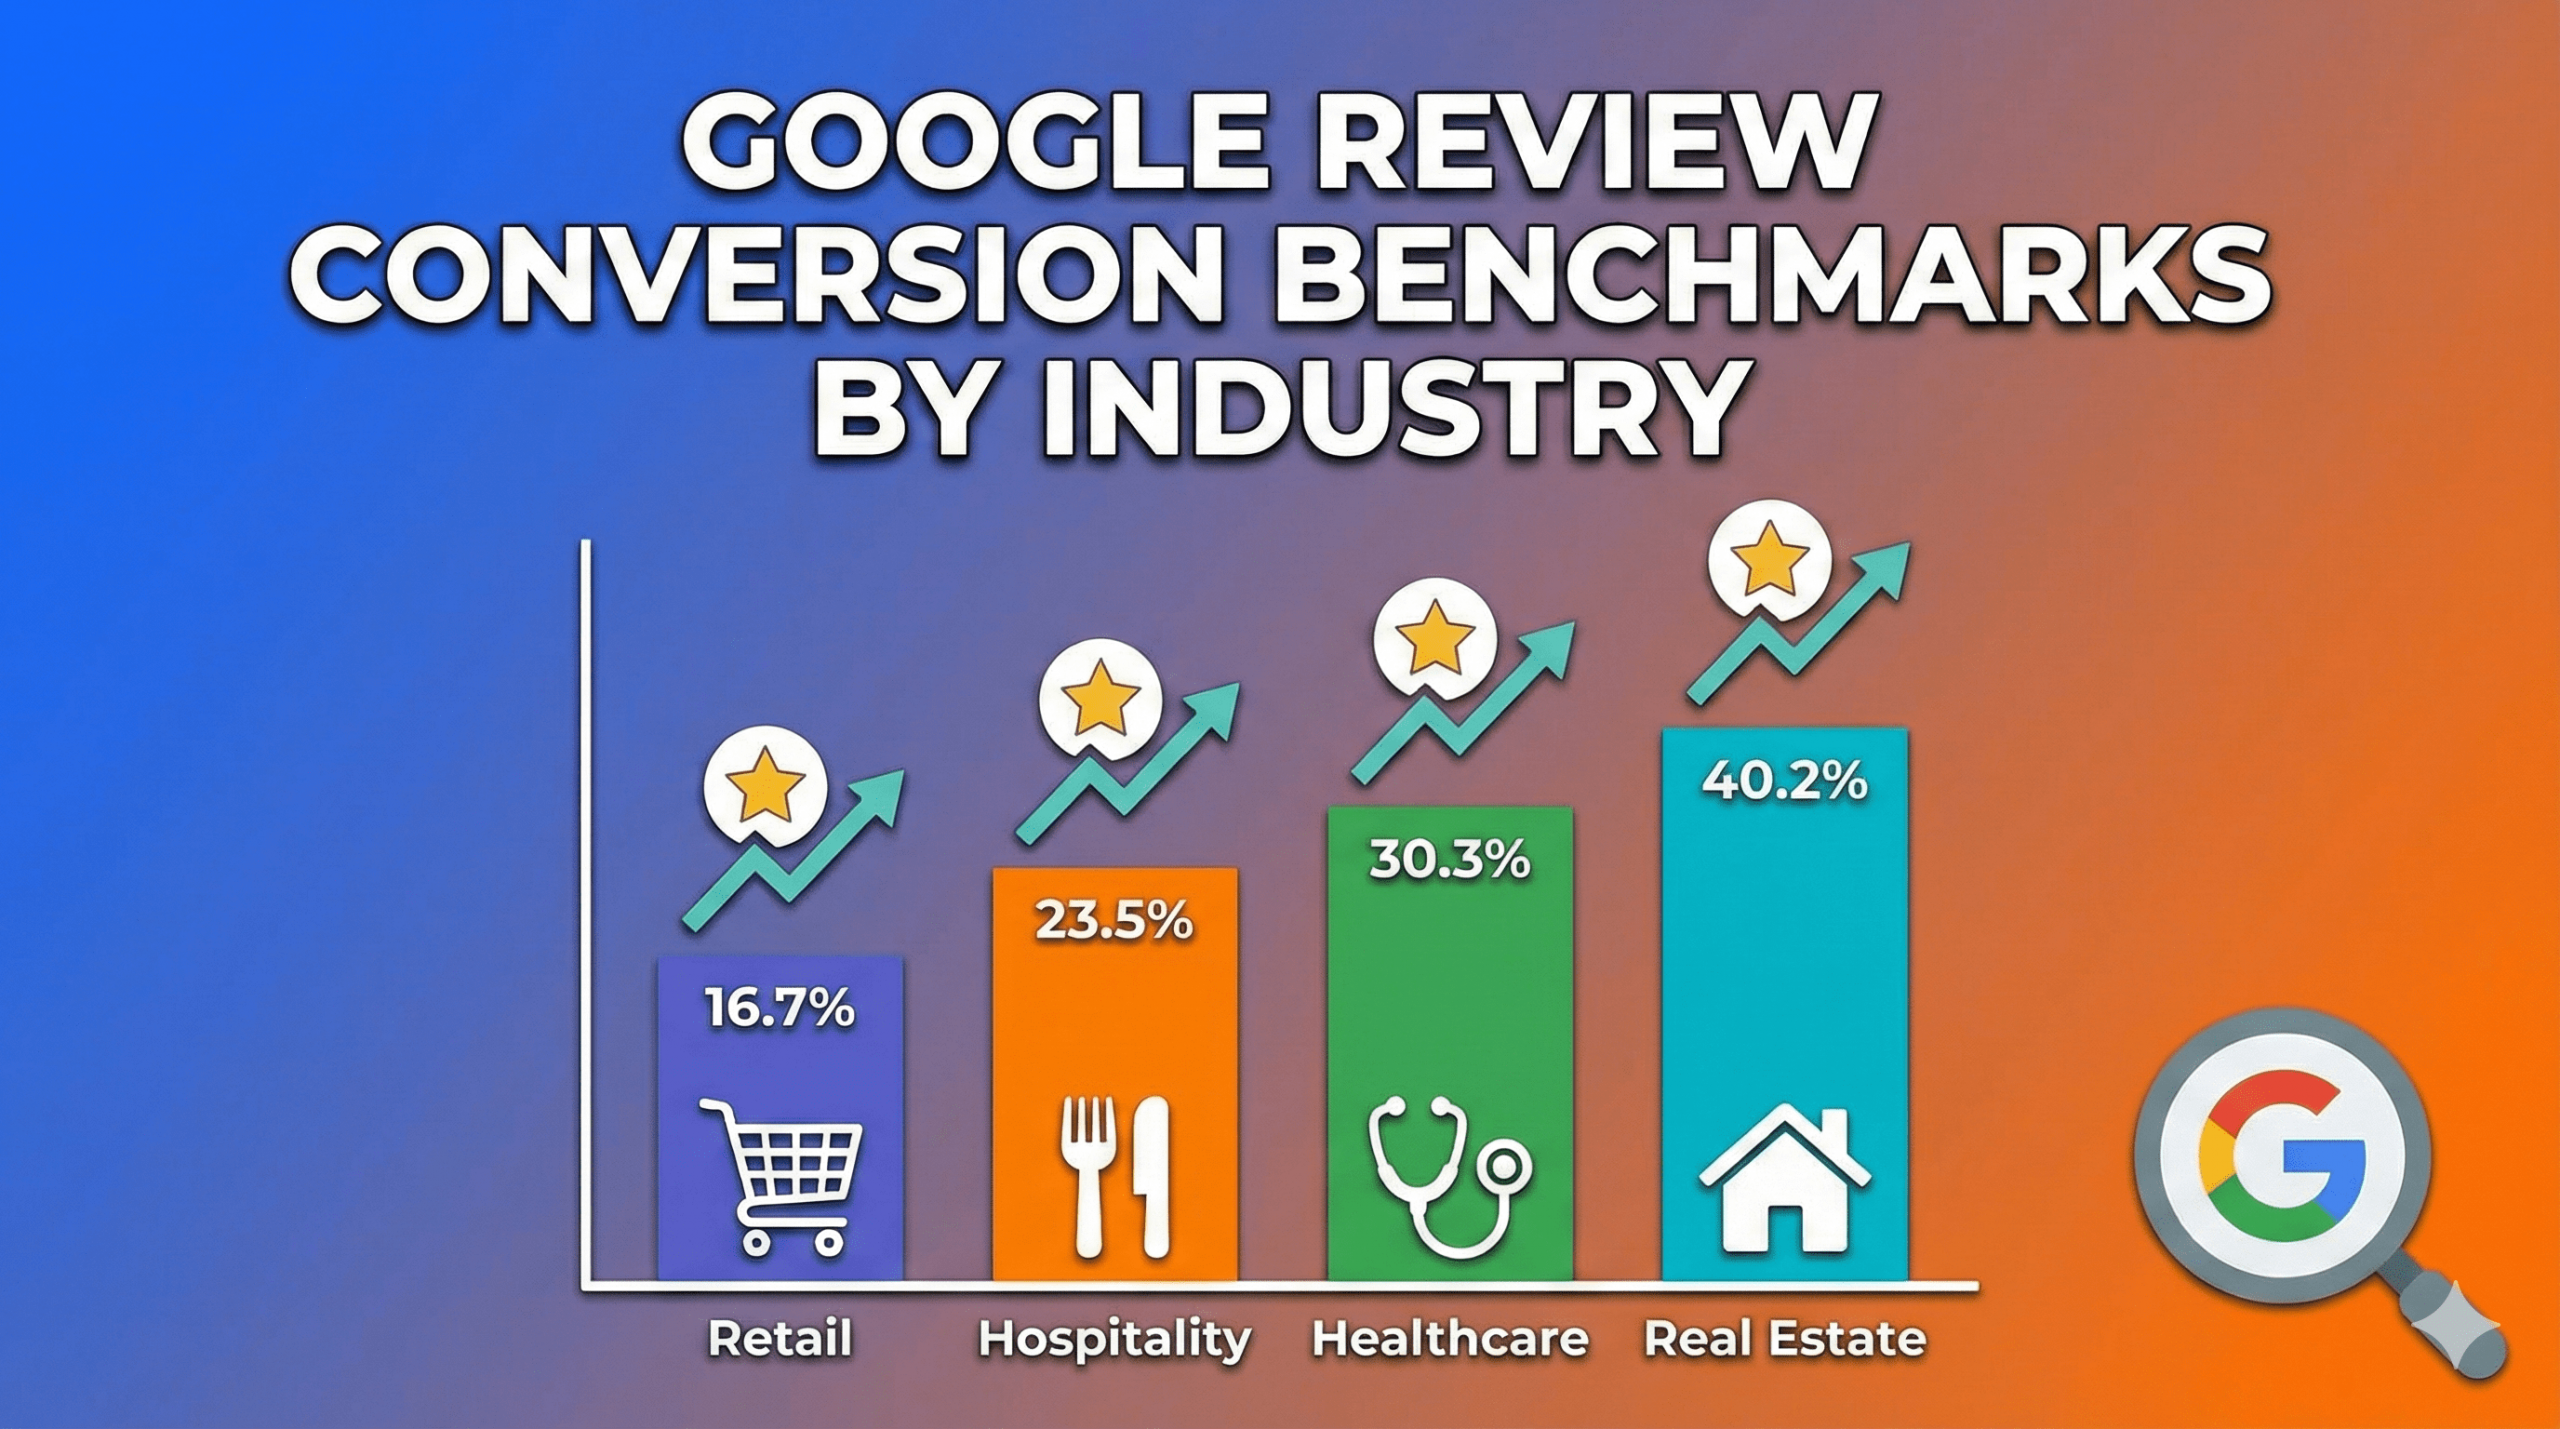
⭐ Global Review Conversion Benchmarks (All Industries)
Across all industries, the average review conversion rate is:
⭐ 3–7%
(If using email/SMS)
⭐ 12–22%
(If using frictionless tools like NFC Review Cards)
Best-in-class businesses reach:
⭐ 25–40% conversion
(with proper staff training + NFC tools + visible review triggers)
Your industry determines where you SHOULD be.
Let’s break it down.
🔥 Google Review Conversion Benchmarks by Industry (2025)
Below are the realistic, competitive, and ideal benchmarks for each sector.
🍽️ 1. Restaurants & Cafés
Customer volume: High
Competitiveness: Very high
Review expectations: Extremely high
| Metric |
Benchmark |
| Review Conversion |
8–15% |
| With NFC Tools |
20–35% |
| Monthly Review Target |
30–120 |
| Ideal Rating |
4.5–4.7★ |
| Critical Success Factor |
Speed + service consistency |
Tools that outperform email/SMS here:
👉 Google Review Stands
👉 Google Review Stickers
Tables, counters, and takeaway bags = perfect touchpoints.
💈 2. Barbershops & Salons
Customer volume: Medium-high
Competitiveness: Medium-high
Review expectations: High
| Metric |
Benchmark |
| Review Conversion |
10–20% |
| With NFC Tools |
25–40% |
| Monthly Reviews |
20–60 |
| Ideal Rating |
4.6–4.9★ |
| Key Signal |
Recency (reviews every week) |
NFC works extremely well because the service ends with emotional satisfaction.
👉 NFC Google Review Cards
🏋️ 3. Gyms, PTs & Wellness
| Metric |
Benchmark |
| Review Conversion |
5–10% |
| With NFC Tools |
15–30% |
| Monthly Reviews |
10–30 |
| Ideal Rating |
4.6–4.8★ |
| Key Signal |
Detailed reviews (“PT name”, “session type”) |
NFC wristbands are incredibly powerful for fitness staff:
👉 Smart NFC Wristband
🛍️ 4. Retail Shops & Boutiques
| Metric |
Benchmark |
| Review Conversion |
3–6% |
| With NFC Tools |
10–18% |
| Monthly Reviews |
10–25 |
| Ideal Rating |
4.5–4.8★ |
| Key Signal |
Review velocity |
Use at checkout:
👉 Google Review Stands
🛠️ 5. Tradespeople (Plumbers, Electricians, Cleaners)
Customer volume: Low-medium
Competitiveness: High
Review expectations: Medium-high
| Metric |
Benchmark |
| Review Conversion |
10–18% |
| With NFC Tools |
20–35% |
| Monthly Reviews |
5–15 |
| Ideal Rating |
4.6–4.9★ |
| Key Signal |
Photo reviews + keywords (“boiler repair”, “Manchester plumber”) |
Perfect for in-field:
👉 NFC Review Cards
👉 Wristbands for field staff
🏥 6. Clinics, Beauty, Healthcare
| Metric |
Benchmark |
| Review Conversion |
7–12% |
| With NFC Tools |
18–30% |
| Monthly Reviews |
10–40 |
| Ideal Rating |
4.7–5.0★ |
| Key Signal |
Sentiment & detailed experience |
Trust is everything → Plaques outperform here:
👉 Google Review Plaque
🏨 7. Hotels, Spas & Hospitality
| Metric |
Benchmark |
| Review Conversion |
5–8% |
| With NFC Tools |
12–20% |
| Monthly Reviews |
20–100 |
| Ideal Rating |
4.4–4.7★ |
| Key Signal |
Review detail (“room type”, “service quality”) |
🚗 8. Car services, garages, valets
| Metric |
Benchmark |
| Review Conversion |
8–12% |
| With NFC Tools |
18–28% |
| Monthly Reviews |
10–30 |
| Ideal Rating |
4.5–4.8★ |
| Key Signal |
Honest reviews + keyword mentions |
Stickers in cars and reception areas work extremely well:
👉 Google Review Stickers
🧱 9. Construction, Landscaping & Large Projects
| Metric |
Benchmark |
| Review Conversion |
3–6% |
| With NFC Tools |
10–18% |
| Monthly Reviews |
3–10 |
| Ideal Rating |
4.6–5.0★ |
| Key Signal |
Detailed project descriptions |
📸 10. Photographers, Videographers & Creative Services
| Metric |
Benchmark |
| Review Conversion |
8–15% |
| With NFC Tools |
20–30% |
| Monthly Reviews |
5–20 |
| Ideal Rating |
4.7–5.0★ |
| Key Signal |
Photo uploads + sentiment detail |
⭐ Industry Summary Table (Quick Overview)
| Industry |
Typical Conversion |
NFC Conversion |
Ideal Rating |
Monthly Review Target |
| Restaurants |
8–15% |
20–35% |
4.5–4.7★ |
30–120 |
| Salons/Barbers |
10–20% |
25–40% |
4.6–4.9★ |
20–60 |
| Gyms/PTs |
5–10% |
15–30% |
4.6–4.8★ |
10–30 |
| Retail |
3–6% |
10–18% |
4.5–4.8★ |
10–25 |
| Trades |
10–18% |
20–35% |
4.6–4.9★ |
5–15 |
| Clinics |
7–12% |
18–30% |
4.7–5.0★ |
10–40 |
| Hospitality |
5–8% |
12–20% |
4.4–4.7★ |
20–100 |
| Automotive |
8–12% |
18–28% |
4.5–4.8★ |
10–30 |
🎯 How to Beat Your Industry Benchmark (The Strategy)
To outperform competitors:
✔ Increase review velocity
Aim for weekly reviews.
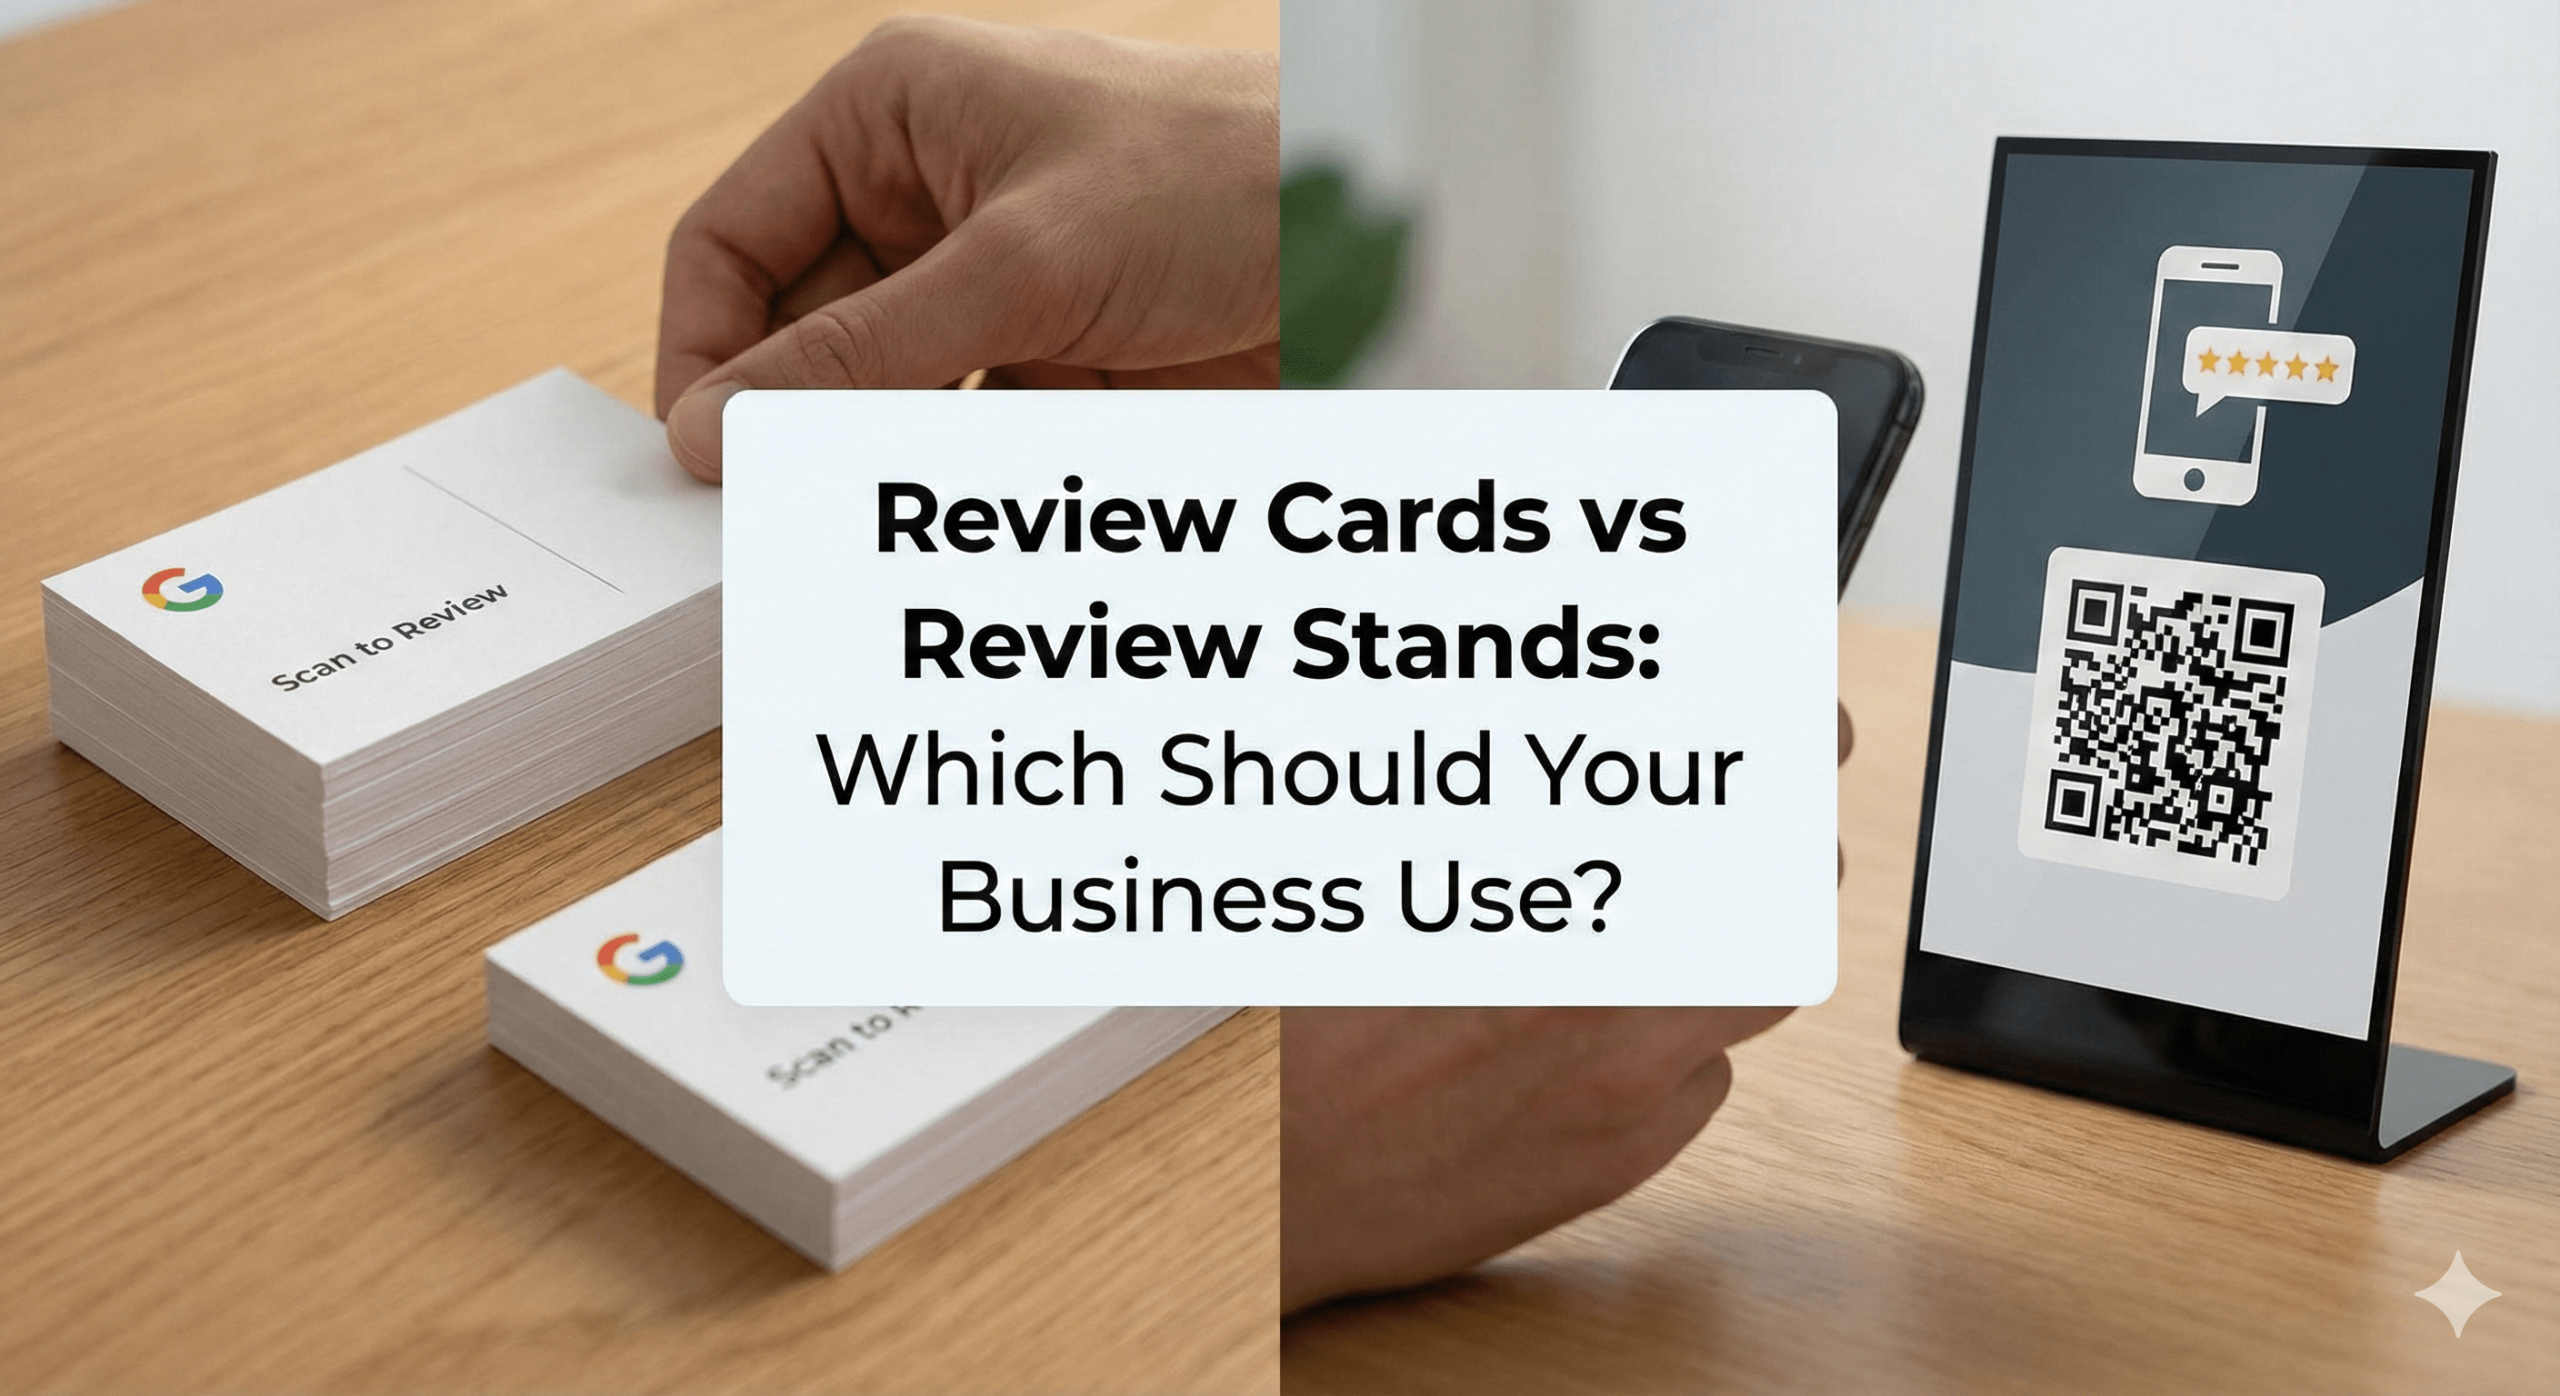
✔ Use frictionless tools
Best choices:
- NFC Review Cards
- Review Stands
- Review Stickers
- Review Plaques
- NFC Wristbands
✔ Train staff correctly
Use simple scripts:
“If you enjoyed your service today, tap here to leave us a quick review.”
✔ Ask at the right moment
Emotional peak moments produce the best reviews.
✔ Add in-store review prompts
More reminders = more reviews.
🧠 AEO FAQ: Google Review Benchmarks
What’s a good review conversion rate?
10–20% is solid.
20–40% (with NFC tools) is exceptional.
What affects conversion the most?
Friction. Remove friction → reviews increase instantly.
Does my industry affect how many reviews I need?
Yes, each industry has different competitive norms.
Can I increase reviews without email or SMS?
Yes — NFC review tools outperform both.
🏁 Final Thoughts: Your Industry Sets the Bar — But You Can Beat It
Every industry has benchmarks. But businesses using modern review tools consistently outperform their competitors. Want to grow reviews 2–5x faster? Use the tools built for frictionless customer action:
👉 NFC Google Review Cards
👉 Google Review Stands
👉 Google Review Plaque
👉 Google Review Stickers
👉 Smart NFC Wristband
👉 Multi Review Card
Beat your benchmark → rise in rankings → increase conversions → grow revenue.